


We get data!
ICA helps communities demonstrate impact, leverage program effectiveness and stabilize families.
Do you need to get more from your client and service data, improve data quality or comply with funder reporting requirements?
The ICA Special Projects Team can help! See data visualization examples below.

Performance Measures Dashboards

System Performance Measures
Year to Year Comparison
Polk County Dashboard

Iowa Balance of State Dashboard

DESCRIPTION
The Iowa Balance of State COC in cooperation with the Polk County Iowa COC and ICA developed the Performance Measures Dashboard. Measures are run on a quarterly basis. The report is dynamic and responsive. Most displayed values have toggles and switches to set parameters. The report was implemented as a Tableau dashboard, providing access to the whole of the continuum membership and community statkeholders.
The response from the committee, the CoC board and the community has been universally positive. This work continues to support real and actionable policy direction within the CoCs.
Point In Time
Point in Time Dashboard, 2007 - Present
DESCRIPTION:
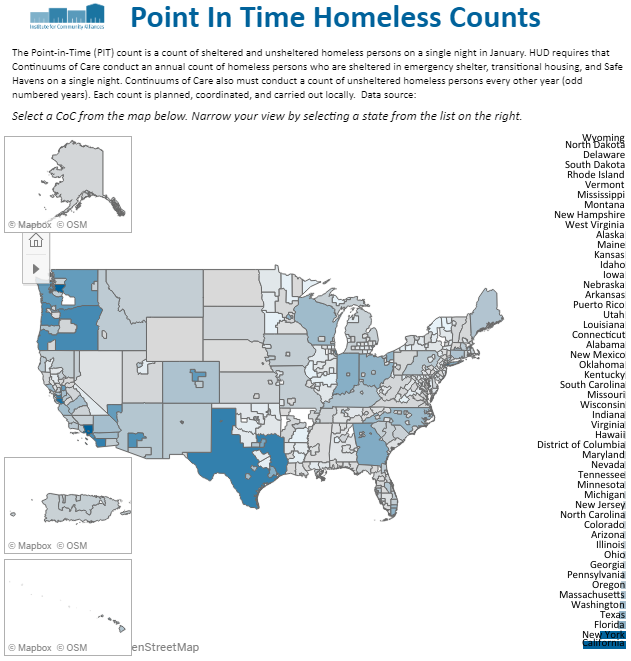
The Point-in-Time (PIT) count is a count of sheltered and unsheltered homeless persons on a single night in January. This dashboard allows you to explore trends in homelessness by subpopulation and household status by each of the regions in the ICA network.
KEY FINDINGS:
Total Homelessness decreased by 16% across all ICA regions in the past 5 years.
25 of 32 CoCs experienced a drop in homelessness with an average decrease of 12.1%.
Joplin/Jasper, Newton Counties CoC in Missouri had the most significant decrease with an 84.3% drop in total homelessness.
The North Dakota Statewide CoC had the largest increase since 2012 at 58.3%.
This is due to significant changes in local PIT count methodology implemented in 2013.
There has been a 47.4% decline in total homelessness since 2013.
Chronic Homelessness dropped by 26% across all ICA regions since 2012.
Both the Dekalb City & County CoC in Illinois & Southwest Minnesota CoC counted 0 chronically homeless individuals.
24 of our 32 CoCs experienced a drop in chronic homelessness with a 15% average decrease.
Veteran homelessness decreased by 35% across all ICA regions since 2012.
Unaccompanied youth homelessness increased by 0.5% since tracking began in 2015.
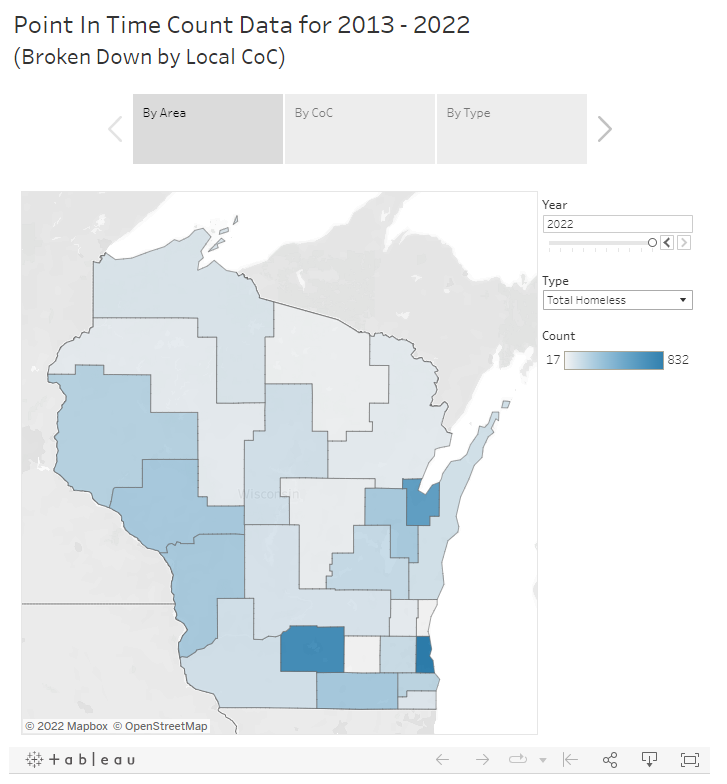
WISCONSIN POINT IN TIME DATA
Zip Code Maps
Iowa Clients by Zip Code of Last Address, 2015

DESCRIPTION:
This dashboard maps the zip codes where clients served in Iowa in 2015 reported last having a permanent address.
KEY FINDINGS:
Most people experiencing homelessness reported a last permanent address in Polk County, followed by Linn and Scott Counties
However, persons experiencing homelessness came from nearly every county in the state