System Performance Measures
CoC Comparison
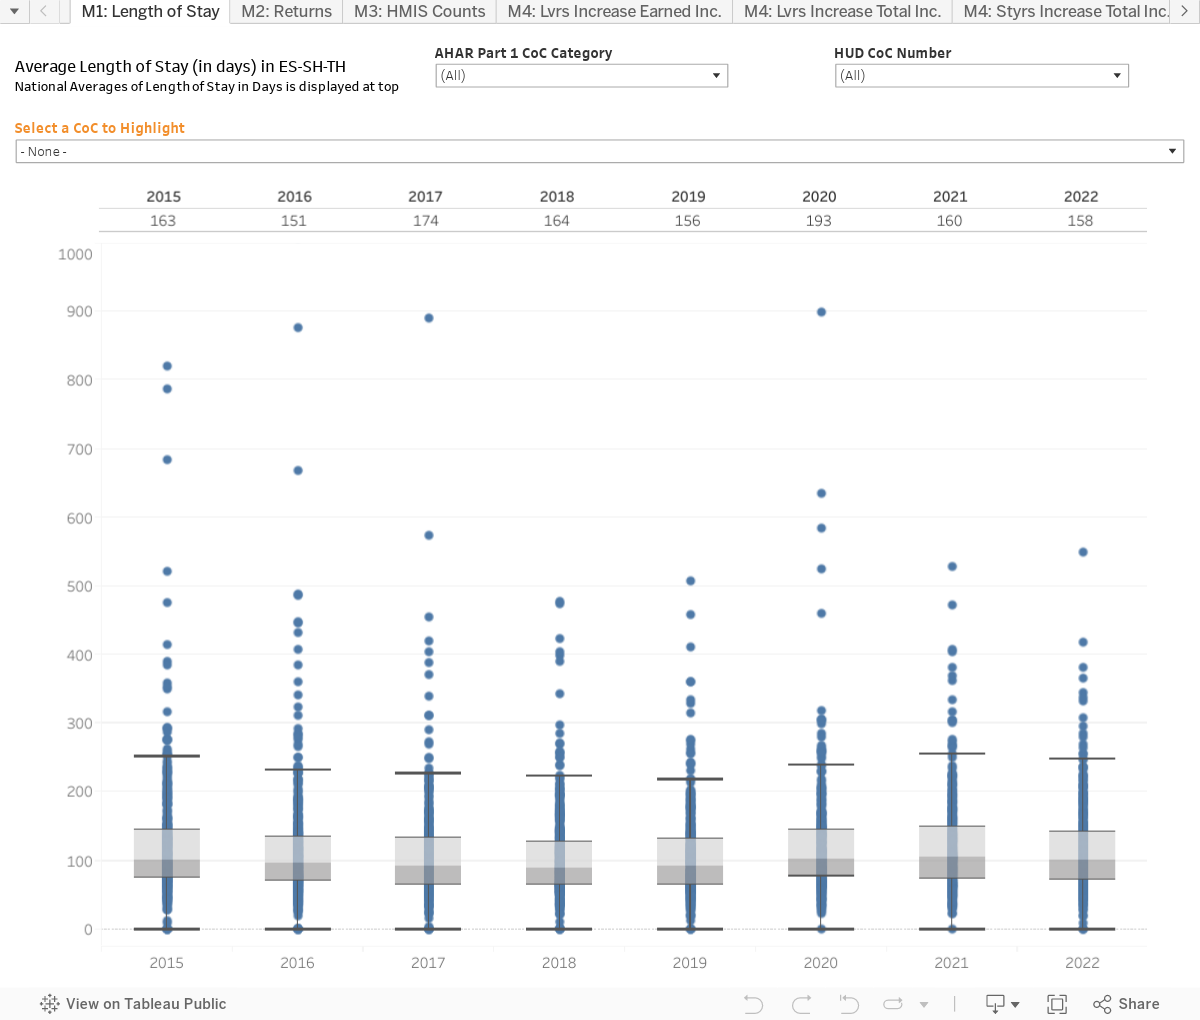
HUD has released 2015-2021 System Performance Measure data for all CoCs. Select your CoC in the Highlight dropdown to see where your CoC ranks.
This dashboard was originally created by HUD. ICA has customized it, allowing you to highlight a CoC for comparison.
Reading the Charts
The charts below are box-and-whisker plots.
CoC values for the measure are sorted from highest to lowest, and each dot represents an individual CoC. Half of all values (the middle 50%) fall within the box. The median, or middle value, separates the two shades. Any dots that extend beyond the whiskers (the two lines outside of the box) are outliers.